


Exponential Functions and Their Graphs
An exponential function in Mathematics is a function that has a constant value raised to the power of an argument (usually the constant “e,” which is approximately equivalent to 2.71828.). There are several real-life applications of the exponent function. Read on to discover them and more about exponential function properties, how to graph exponential functions, formulas, graphs, examples, practice problems, and more.
Here is what we will cover in the article:
- What is an exponential function? Exponential function formula
- Exponential function derivative
- Properties of exponential functions
- Graph exponential functions
- How to find an exponential function from a graph?
What is An Exponential Function? Exponential Function Formula
An exponential function has the following form
f (x) = ax.
Here,

“x” stands for a variable and is a real number.
“A” represents a constant and is called the function’s base. The base should be greater than 0, i.e., a>0, which is not equal to 1. The transcendental number “e” is approximately equal to 2.71828 and is mostly used as the base of the exponential function.
Exponential Functions Examples
Some examples are:
- f(x) = 3x+2
- f(x) = 5x
- f(x) = 2e2x
- f(x) = (1/ 4)x = 4-x
- f(x) = 0.7x
Exponential Function Derivative
The derivatives can be given as follows:
d(ex)/dx = ex
Also, the exponential function f(x) =ex has a special property. So, the derivative of the exponential function is the function itself as given below:
f ‘(x) = ex = f(x)
Properties of Exponential Functions
You must understand the properties of the exponential functions to perform calculations. The key properties are as follows:
- Rule of product
ax ay = ax+y
e.g., 52 x 53 = 52+3 ⇒ 55 = 3125
- Rule of quotient
ax/ay = ax-y
e.g., 54 x 52 = 54-2
⇒ 52 = 25
- Power rule
(ax)y = axy
e.g. (52)3 = 52×3
⇒ 56 = 15,625
- Power of a product
axbx=(ab)x
⇒ 22 32 = (2 x 3)2
⇒ 62 = 36
- Power of fractions
(a/b)x= ax/bx
⇒ (6/2)2 = 62 /22
⇒ 36/4 = 9
- Negative Exponent rule
a-x= 1/ ax
2-2= 1/ 22
= 1/4
- Zero exponent rule
a0=1
e.g. 50=1
Here a> 0 and b>0, x and y are real numbers.
| Example 1: Solve 4x = 45 Solution: Since the given bases are the same (i.e., 4), we will equate the powers. Answer: The value of x is 5. Example 2: Solve 51-x = 55 Solution: Since the given bases are the same (i.e., 5), we will equate the powers. 1-x = 5 -x = 5-1 -x = 4 x =-4 Answer: The value of x is -4. |
Graph Exponential Functions
Which graph represents an exponential function? An exponential function graph is an upward curve, as shown in the following image. This graph is always nonlinear as its slopes are always changing.

Here, x > 1, the value of y = fn(x) will increase when we increase the values of (n). Also, the curve will get steeper as the exponent increases. The rate of growth will increase too.
How to Graph Exponential Functions?
Now, we will learn how to graph exponential functions. One of the best ways to graph exponential functions is by finding a few graph points and sketching the graph based on those points.
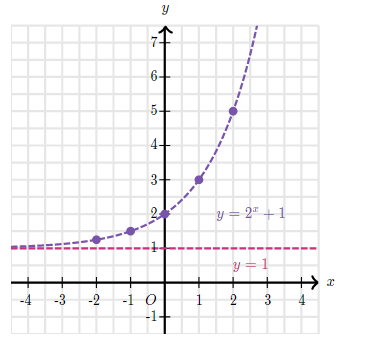
To find a point on the graph, we will first select an input value. Now, calculate the output value from the input value. For instance, for the function f (x) = 2x+1.
To find the value of y when x =1, we can use f(1)
f (1) = 21 + 1
= 3
So, we have our first point for the graph now, that is (1, 3).
Using the points on a graph, we can identify the following important features of the graph:
- y-intercept
- Whether the slope of the graph positive or negative?
- How does the value of y change with an increase in the value of x?
The y-intercept
The y-intercept of an exponential graph is important as it helps us identify a number of other features. We have to evaluate the function at x = 0, to find the value of the y-intercept.
f(x) = 2x + 1
f(0) = 20+1
= 1+ 1
= 2
Slope
To determine the slope of the graph, we use f (0) and f (1). The slope is either increasing or decreasing. The following two statements will help you determine the slope of the exponential function graph.
- When f (1) > f (0), then the graph has a positive slope.
- When f (1) < f (0), then the graph has a negative slope.
In the above-mentioned graph example — f (x) = 2x+1, f(1) = 3 and f(0) = 2. Since f (1) > f(0), the slope of the graph is positive.
End behavior
The term end-behavior refers to the relation between x and y. We study what happens to the value of y when x becomes very large in positive or negative directions.
When we graph exponential functions, the value of y grows to positive or negative infinity towards one end. It approaches but does not reach the horizontal line. This horizontal line that the exponential function graph approaches but fails to reach is called the horizontal asymptote.
To graph exponential function, f (x) = 2x+1, we will calculate a few more points
f (-2) = 2-2+1
= 1.25
f (-1) = 2-1+1
= 1.5
f (2) = 22+1
= 5
So, the points are (2,5), (-2, 1.25), and (-1, 1.5). Now, we can graph the exponential function.
Steps to Graph Exponential Function
The following steps will help you graph exponential functions easily:
- Step 1: We will evaluate the exponential function for different values of x. We will begin with x= -1, 0, 1, and find additional points if required.
- Step 2: Now, we will use the points to sketch a graph curve, establishing the direction of the slope and the y-intercept.
- Step 3: We will extend the curve on both ends. While one end will reach a horizontal asymptote, the other will approach negative or positive infinity along the y-axis.
How to Find Exponential Function from a Graph?
We can find the exponential function equation from a given graph. It is a multi-step process. Every graph will provide different information depending on its type. We can decipher some information from the given graph itself, and we can then solve for other requirements for the exponential graph equation. Here is a list of the variables we must look for in the given graph:
a – It will be given, or we can solve it by employing algebra.
b – It will be given, or we can solve it using algebra.
c – If we assume x = 0 and ignore c, then the value of y will be equal to the y-intercept. Next, we will count the number of units the y-value is from the y-axis. This number will give us the value of “c.”
d – We solve it.
k – It is equal to the horizontal asymptote value.
Let us consider an example to completely understand the process of how to ding exponential function from a graph.
Example: Find the exponential function ( y= abx) from the given graph.
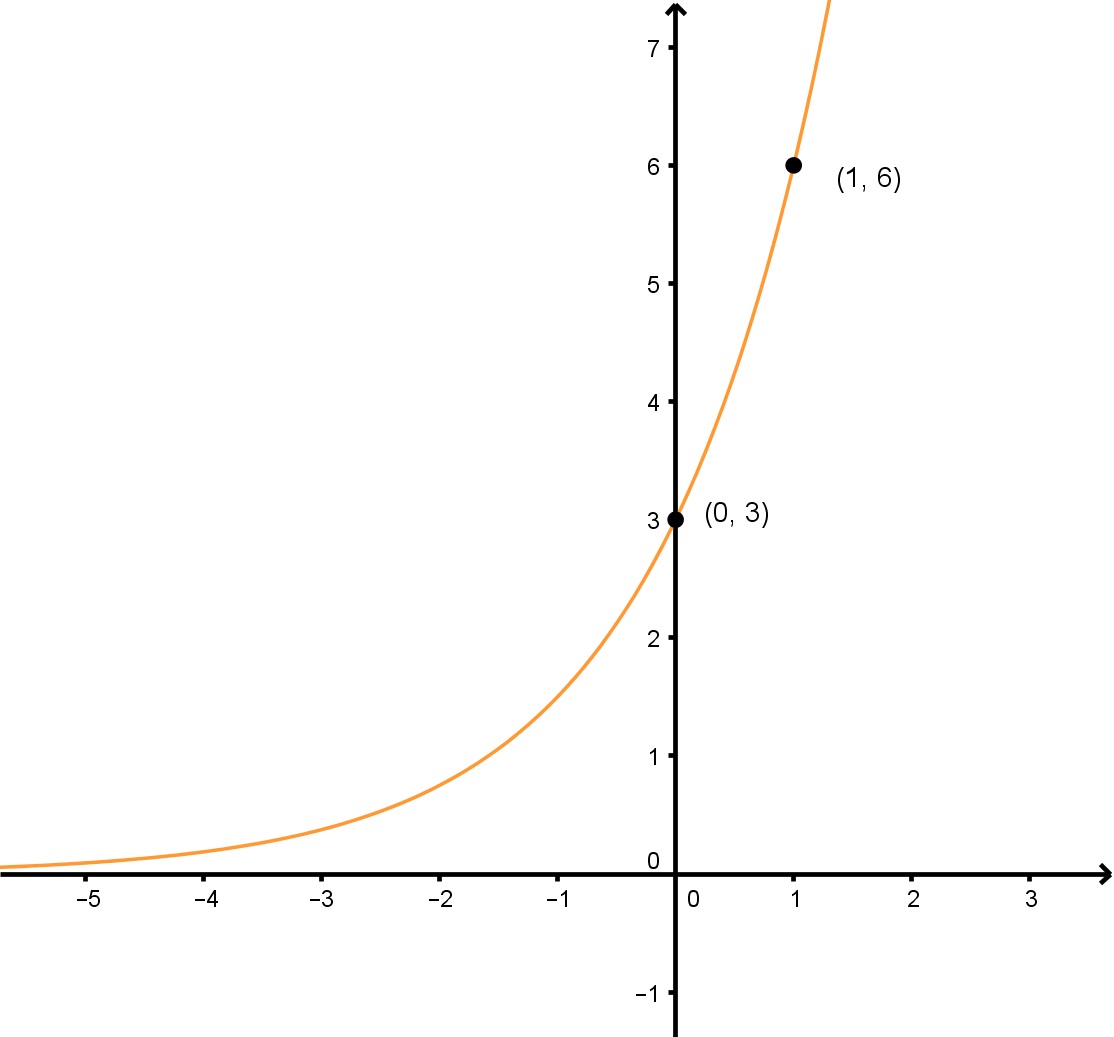
Solution: For this graph solution, we will have to find the values of a and b.
To solve for a, we will choose a point from the graph that eliminates b, as we don’t know b yet. So, we will pick up the y-intercept, i.e., (0,3).
Since y = abx (given)
= 3 = ab0
= 3 = a1
So, a = 3
To solve for b, we will pick up another point from the graph, say (1,6).
Since y = abx (given)
= 6 = 3b1 ( We will substitute the value of a that we had calculated in the previous step.)
So, b = 2
To write the final equation, we will substitute the values we have calculated in the given equation form.
As, y = abx and a = 3, b = 2
The equation will be y = 3(2)x
| Practice Problems Question 1: Solve the following equations: a.62x = 625 b.24-x = 25 c.41 = 4 + 45 – 4 Question 2: Given the function f(x)= 3x, evaluate each of the following. a.f(3) b.f(0) c.f4/5 d.f(1) Question 3: Given the function f (x) = (4/3)x a.Evaluate f (-3) b.Evaluate f (4) Question 4: Sketch the graph for f(x) = e-x + 2 Question 5: Sketch the graph for y = 5(2)x |
Frequently Asked Questions
1. Which graph represents the given exponential function?
Ans. The graph on the left represents the given exponential function. The graph is an exponential curve because it rises exponentially from left to right.
2. What are the characteristics of a graph of an exponential function?
Ans. Exponential functions are graphs that look like this: y = b^x, where b is the base, and x is the exponent. The exponent tells you how many times to multiply by itself. So if we want to find the value of y at x = 2, then we can plug 2 into our equation: y = b^x, so y = 2^3, which simplifies to 8.
3. How to determine if the graph is exponential?
Ans. We can determine if a graph is exponential by checking to see if it has a consistent slope. The slope of an exponential curve is equal to the constant rate of growth, which means that all points on the curve are at a constant distance from each other. If the graph doesn’t have a consistent slope, then it’s not exponential.
4. How to graph and transform an exponential function?
Ans. The graph of an exponential function is a straight line with a positive slope. The line passes through the origin, and its slope is equal to the constant rate of change (rate of growth) of the function. When a function is graphed in the coordinate plane, its value can be determined by locating where it crosses the y-axis. For example, if you wish to transform 2x^3 into y = 8x^2 + 2x – 12, you would divide 2 by 3 and subtract two from each side of the equation so that x = 2/3y + 1/3.
5. What does an exponential graph look like?
Ans. An exponential graph looks like a line that goes up and down, with a “tail” at the beginning.

Related topics

Square 1 to 20 : Chart, Table, Perfect Squares and Examples
Square 1 to 20 When you multiply a number by itself, the result is called a square. And when you’re preparing for exams, you need to have a foundation for algebra and quick mental math because you get a really short time to do your exam. Therefore, learning the squares from one to twenty is […]

Square 1 to 40 : Table, Perfect Squares, Chart and Examples
Square 1 to 40 When you multiply a number by itself, the resulting number is a square, and if you are someone who is either appearing in a competitive exam or just wants to do well in math in school, knowing square 1 to 40 is a really important skill. But manually multiplying every time, […]

Square Root : Definition, Formula, Methods and Types Explained
Square Root Square roots are one of those seemingly daunting maths topics that appear in many different situations, from algebra to geometry. Yet the concepts behind them aren’t as hard to grasp. It makes handling numbers far easier if you know the concept well. Let us understand how to find the square roots of a number […]

Cubes 1 to 20 : Chart, Table, Memory Tricks and Examples
Most students don’t struggle much with smaller cubes like 2³ or 3³. Those usually come quickly. The hesitation starts with numbers like 11³ or 17³. Or when someone suddenly asks, what is 20 cubed? That pause is not a memory problem. It’s about the lack of proper understanding and hence confidence. Naturally, learning cubes 1 […]


Other topics


Comments: