


Linear Function – Definition, Equation, Graph, Examples
Linear Functions
In Mathematics, a function is a relation with the property wherein every input is related to exactly one output. Linear functions are of great importance because of their universal nature. They can be implemented in numerous situations. Moreover, they appear in different forms of equations. So, what is a linear function? A linear function is a function with either one or two variables without any exponents. This function represents a straight line on the coordinate plane. If the function has more variables, then they have to be constant to remain in the same linear function condition. In this article, we will learn in detail about:
- What is a linear function?
- Linear functions equation
- Characteristics of a linear function
- Rate of change of a linear function
- Linear function graph
- Linear function table
- Linear function examples from real-life
- Solved problems on linear functions
What is a Linear Function?
Linear function definition: A linear function is an algebraic function that forms a straight line in a coordinate plane. Generally, it is a polynomial function with a maximum degree of 1 or 0. The linear functions are also expressed in terms of calculus and linear algebra. The main difference lies in the function notation. It is necessary to know an ordered pair written in function notation. For example, the function is written as follows:
f(2) = 3 and f(5) = 2
The ordered pair will be (2, 3) (5, 2)
A linear function can be written as;

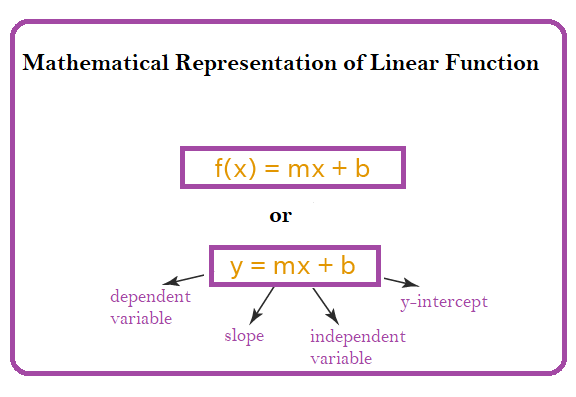
y = f(x) = mx + b
This equation appears like the slope-intercept form of a line that is given by y = mx + b because a linear function represents a horizontal line. i.e., its graph is a line.
On the contrary, a nonlinear function is not linear, i.e., it does not form a straight line in a graph. An exponential function is an example of a nonlinear function.
Linear Functions Equation
We can represent a linear function by the following expression:
y = f(x) = mx + b (slope-intercept form)
In the above equation,
‘m’ and ‘b’ are real numbers where ‘m’ is the slope of the line, and ‘b’ is the y-intercept of the line.
‘x’ is the independent variable
‘y’ or f(x) is the dependent variable
The linear function can also be represented in point-slope form as
y−y1=m(x−x1)
While in the standard form, it is written as
Ax + By = C
Characteristics of Linear Function
Here are some important characteristics of linear functions:
- A variable is a symbol that shows a quantity in the expression.
- The rate at which a linear function deviates from a reference is represented by steepness.
- The direction of linear functions can be increasing, decreasing, horizontal, or vertical.
- A decreasing linear function that has a negative slope. So, if m<0, then f(x) = mx + b is decreasing.
- An increasing linear function is a function that has a positive slope. So, when m>0, f(x)=mx+b increases.
- The y-intercept is the value of a function and zero is the input value. It is known as the initial value.
- When m=0, the linear function f(x) = mx + b is a horizontal line and is referred to as a constant function.
Rate of Change of A Linear Function
The rate of change of a linear function is also called the slope. An equation in slope-intercept form of a straight line. It includes the slope and the initial value of the function. The y-intercept or the initial value is the output value when zero is the input of a linear function.
For instance, velocity is the rate of change of distance over time. If we know the two points in time and the total distance traveled, we can determine the rate of change, also known as the slope. Using the information, we can form a linear equation and make predictions from the line equation.
Linear Function Graph
To represent any linear equation on a graph, we follow three simple steps:
- First, find the two points (x1, x2) and (y1, y2) that satisfy the equation, y = mx+b.
- Plot these points in the graph or X-Y axes.
- Form a straight line to join the two points in the plane.

Furthermore, the formula for the slope of a linear function: m= y2-y1/x2-x1
Once we have the slope, we can use one of the known points and the slope-intercept formula to find b.
Linear Function Table
Tabular data containing values of x and y can help verify the linear function.
To determine whether a given tabular data satisfies linear function or not, we will compute the differences in x-values. Next, we will determine the differences in y values. Now, check the ratio (difference in y)/(difference in x) every time. If the ratio is a constant, then the data represents a linear relationship.
Also, in a linear function, the rate of change of y concerning the variable x remains constant. As stated above, this rate of change is the slope of the line when represented graphically.
Let us consider the following table with x and y values,
| x | y |
| 0 | 4 |
| 1 | 5 |
| 2 | 6 |
| 3 | 7 |
| 4 | 8 |
From the above table, we can observe that the rate of change between x and y is 4. To represent this data using the linear function, we can write as y = x+4.
Linear Function Examples from Real-Life
There are many real-life examples of linear functions, including distance and rate problems, dimension calculations, pricing problems, mixing percentages of solutions, and more. The below-mentioned linear function examples from real-life applications help us understand the concept of linear functions.
- A gaming service charges a monthly fee of $5.50 and an additional fee of $0.45 for every game. Then the total monthly fee can be represented by the linear function f(x) = 0.45x + 5.50, where x is the number of games that a user downloads in a month.
- A biscuit packet costs $20. There is a linear relationship between the money you spend and the number of biscuit packets you buy. So, as per the standard form, A=20x, where A is the amount of money spent and x is the number of biscuit packets bought.
- A bakery earns $150 per month, while its one-time start-up cost is $200. A linear function representing this situation would be y=150x−200.
In this equation, the variable x represents the number of months they earned profits. The variable y is for the bakery’s total revenue per month after the initial month. Now, this linear function equation helps the bakery committee predict future revenues. For example, in 6 months, they can expect the revenue to be: 150(6)−200=700 dollars.
Solved Problems with Linear Functions
| Example 1: Rewrite the following function as ordered pairs to draw a graph successfully. f(3) = -2 and f(-8) = -4 Answer: The above function can be written as (3, -2) and (-8, -4) |
| Example 2: Find the slope of a graph for the following function. f(1) = -1 and f(-4) = -6 Answer: The above function can be written in ordered pair form as (1, -1) and ( -4, -6) Now using the formula of the slope we can evaluate the slope. m = y2-y1/x2-x1 (1, -1) and ( -4, -6) correspond to (x1, y1) and (x2, y2) So, m= -6-(-1)/-4-1 m= -5/-5 So, m = 1 i.e., the slope of the function. |
| Example 3: Find the equation of linear function (-1, 15) and (2, 27). Answer: Using the slope formula, we can evaluate the slope.(-1, 15) and (2, 27) correspond to(x1, y1) and (x2, y2) m = y2-y1/x2-x1 m= 27-(15)/2-(-1) m=12/3 m= 4 The slope is 4. We can now write the equation for the linear function by substituting values y – y₁ = m (x – x₁) y – 15 = 4 (x -(-1)) y – 15 = 4(x +1) y – 15= 4x +4 y= 4x +19 So, y= 4x +19 is the equation for the given function. |

Related topics

Square 1 to 20 : Chart, Table, Perfect Squares and Examples
Square 1 to 20 When you multiply a number by itself, the result is called a square. And when you’re preparing for exams, you need to have a foundation for algebra and quick mental math because you get a really short time to do your exam. Therefore, learning the squares from one to twenty is […]

Square 1 to 40 : Table, Perfect Squares, Chart and Examples
Square 1 to 40 When you multiply a number by itself, the resulting number is a square, and if you are someone who is either appearing in a competitive exam or just wants to do well in math in school, knowing square 1 to 40 is a really important skill. But manually multiplying every time, […]

Square Root : Definition, Formula, Methods and Types Explained
Square Root Square roots are one of those seemingly daunting maths topics that appear in many different situations, from algebra to geometry. Yet the concepts behind them aren’t as hard to grasp. It makes handling numbers far easier if you know the concept well. Let us understand how to find the square roots of a number […]

Cubes 1 to 20 : Chart, Table, Memory Tricks and Examples
Most students don’t struggle much with smaller cubes like 2³ or 3³. Those usually come quickly. The hesitation starts with numbers like 11³ or 17³. Or when someone suddenly asks, what is 20 cubed? That pause is not a memory problem. It’s about the lack of proper understanding and hence confidence. Naturally, learning cubes 1 […]


Other topics


Comments: